

Blog 1 in a Series on Common Gaps in Building an Analytics-Driven Organization
In my work, I see a major uptick in utilities implementing, improving or planning analytics initiatives in the next twelve months. If this sounds like you, read on.
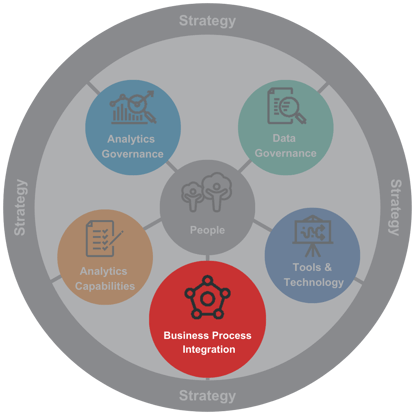
For utilities, successful analytics initiatives can empower decision makers with data-driven insights and actionable information, but poorly focused initiatives can waste time and effort by working in areas that yield less-than-stellar results. The best way for utilities to guard against unproductive analytics initiatives is to know (and to properly use) the Seven Dimensions of Analytics Maturity as defined by the Utility Analytics Institute (UAI). See Blog 0 of 7 – Laying the Groundwork for important background information. Figure 1 shows a depiction of the UAI framework and indicates the focus area of today’s topic.
Business Process Integration – The UAI View
Let’s start by reviewing how the UAI views Business Process Integration:
“The degree to which data and analytics are integrated into the development and measurement of business KPIs, and the degree of access that employees have to analytic tools and data.”
We at Utegration concur with the UAI view. Furthermore, we believe it is worthwhile to emphasize a few implications that are baked deeply into this definition that may not jump out sufficiently to inexperienced practitioners. Indeed, success or failure of many analytics implementations can be traced to attention (or the lack thereof) being paid to these underlying implications. More often than not, successful and effective Business Process Integration efforts have a strong focus on these implications.
Focus Areas for Successful Business Process Integration (BPI)
First of all, let’s underscore “data and analytics” in the BPI description above. Meaning ready and reliable access to appropriate and trustworthy data is paramount to enabling effective and successful BPI. It sounds obvious, but it isn’t in all situations. We often find that purely top-down Business Process Reengineering (PBR) initiatives that looked good in theory sometimes fail in practice due to neglecting this essential element. Further ahead in this blog, I provide an example of where proper focus in this area helped lay the groundwork for success. In the end, powering the analytics with the proper data is essential. So… the questions around data become… What is the ‘proper’ data? How do we integrate it?
This brings us to the second baked-in implication. The phrase “…integrated into the development and measurement of business KPIs” implies clarity on the following:
- What are the business KPIs?
- How / where are the KPIs measured?
- Are the KPIs aligned to (developed in conjunction with) the business process being integrated?
These points can also be more daunting in practice than in theory. This truth is borne out by the fact that in some engagements our practitioners spend a substantial amount of time helping organizations clarify KPIs and assure that full measurement data is available in a ready and reliable manner.
Looking more closely at the third bullet above, for me, this is another way of saying that the business process and KPIs must be effectively and efficiently aligned with the true business objectives. By ‘effectively aligned’, we mean that the process, KPIs and measurement data must truly support the business objectives. (Don’t laugh. Problems occur here more often than one might think.) By ‘efficiently aligned’ we mean that the process is fully supported with data at all levels, and that the design supports integration into an analytics-driven environment.
Top Pitfalls of Analytics BPI Initiatives
Analytics Business Process Integration efforts most often fail in a couple of main ways. Either the business processes themselves are imperfectly aligned with the business objectives, or the processes simply lack ready and reliable access to full data at all levels. I don’t know which is worse, the former or the latter. Luckily, both situations are usually simple to identify and remedy in most organizations given a team with proper insight, experience and preparation.
Have a look at the X-Y scatter plot diagram below. It shows a notional mapping of Analytics BPI initiatives based on the characteristics that most influence overall success. The y-axis indicates increasing degrees of process alignment with business objectives. The x-axis depicts the level of ready and liable access to appropriate and trustworthy data. The mappings fall into groupings that generally cluster into quadrants. I have named the grouping to reflect their characteristics.
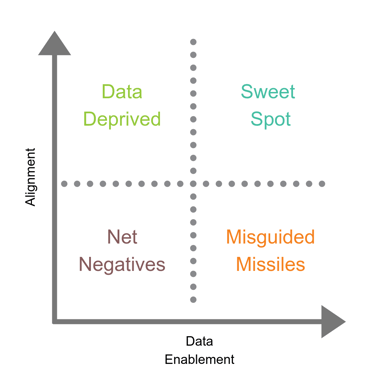
The Sweet Spot
The upper right quadrant, or the ‘Sweet Spot’, as some would say, contains the most successful Analytics BPI initiatives. These initiatives exhibit high levels of process alignment as well as high access to appropriate supporting data. This is the ideal for Analytics BPI initiatives, and this is where every organization wants to be.
The Data Deprived
The upper left quadrant contains initiatives that have potential but are not yet effective because they lack access to needed data. They got the vision right and were headed the right direction, but they crash and burn for lack of data in certain circumstances. Think, for example, of executive dashboards that present useful KPIs in brilliant useful ways, but that rely on a small army of competent workers to feed spreadsheets to roll up details to the top level. This may seem fine so long as nothing goes wrong, but things always go wrong eventually. And when they do, this type of dashboard often cannot drill-thru to the online details in order to help clarify and rectify the causes of the exceptions. Instead, the business must pause and wait for the marching army of spreadsheet supporters to dig into the underlying data searching for the cause of the problems. These initiatives will stay in the doldrums until supporting data is available and the processes are reengineered to acquire and leverage that data. Luckily, these initiatives can usually be corrected with insight and appropriate action plans.
The Misguided Missiles
The lower right quadrant is populated with misguided initiatives that have all the data they need, but are somehow not focused on the proper process. This can happen when processes are improperly aligned with business objectives, and it can happen more than you think. At best, these initiatives can be turned around with proper insight and a business process re-engineering effort. At worst, faulty data from these initiatives can encourage less experienced practitioners to feel justified in doing exactly the wrong thing for the business. Any initiative in this grouping probably deserves a speedy evaluation.
The Net Negatives
The lower left quadrant houses the “net negatives.” They are mapped into this area because they probably implemented a flawed business process. Luckily, they also lack the data to be able to get much done, so the level of damage they can do is usual small. Still, initiatives in this area waste money and time. They can sometimes be revived with proper refocusing on processes and data.
A Sweet Spot Example
When scanning the Utegration landscape, I didn’t have to look far to find an example where BPI is going right in a complex Meter-to-Cash environment. My colleague Irene Chen is leading a project for a major utility in the southern U.S. that is clearly a ”sweet spot” initiative. The initiative involves an operational dashboard that allows full drill-thru to the underlying exception data when things go wrong. Here are some of the benefits:
- Provides situational awareness of transactions and controls across systems
- Integrates with transaction systems
- Provides data lineage, reconciliation and reporting for business controls and regulatory purposes
- Applies machine learning and predictive analytics to classify exceptions and recommend solutions
- Increases team capacity due to automation of manual reconciliations and exception management activities
- Analysts spend more time resolving issues than performing exception research
- Mitigates regulatory compliance and transaction risks
Something About Utegration’s Culture
The above example is a work in progress. According to the client, things are very much on track, so I look forward to reporting final outcomes in a future blog. Meanwhile, this example brings to light one of my favorite features of the #oneteam culture at Utegration, and that is matching global resources to every need. To manage the implementation above, Irene travels almost weekly from Toronto, ON, to our client in the Southern U.S. Why? Simple. Because she is among the best practitioners to lead this type of engagement. That’s our culture. We bring the best available to the client – not just the best available within a 50-mile radius of the client’s home offices.
We know every situation is unique. If you would be interested in having Utegration take a close and thoughtful look at your organization’s unique circumstances, please reach out to the author or any of my Utegration colleagues for a no-obligation conversation.
And remember, the best way to stay informed is to follow Utegration on LinkedIn or Twitter, and to subscribe to our blog. You can also follow me on @UtilityBill_101.
